AdvancedMD offers two financial reporting products. Our standard reporting is included with every subscription to our practice management. Our advanced reporting suite (previously known as AdvancedInsight) is an optional add-on feature and provides more robust data analytics and rich business intelligence. We’re pleased to announce our newly refreshed advanced Reporting and Analytics with a new look and feel. You’ll love our new report building, dashboard configuration, pinning, and dozens of new productivity enhancements.
Data Table
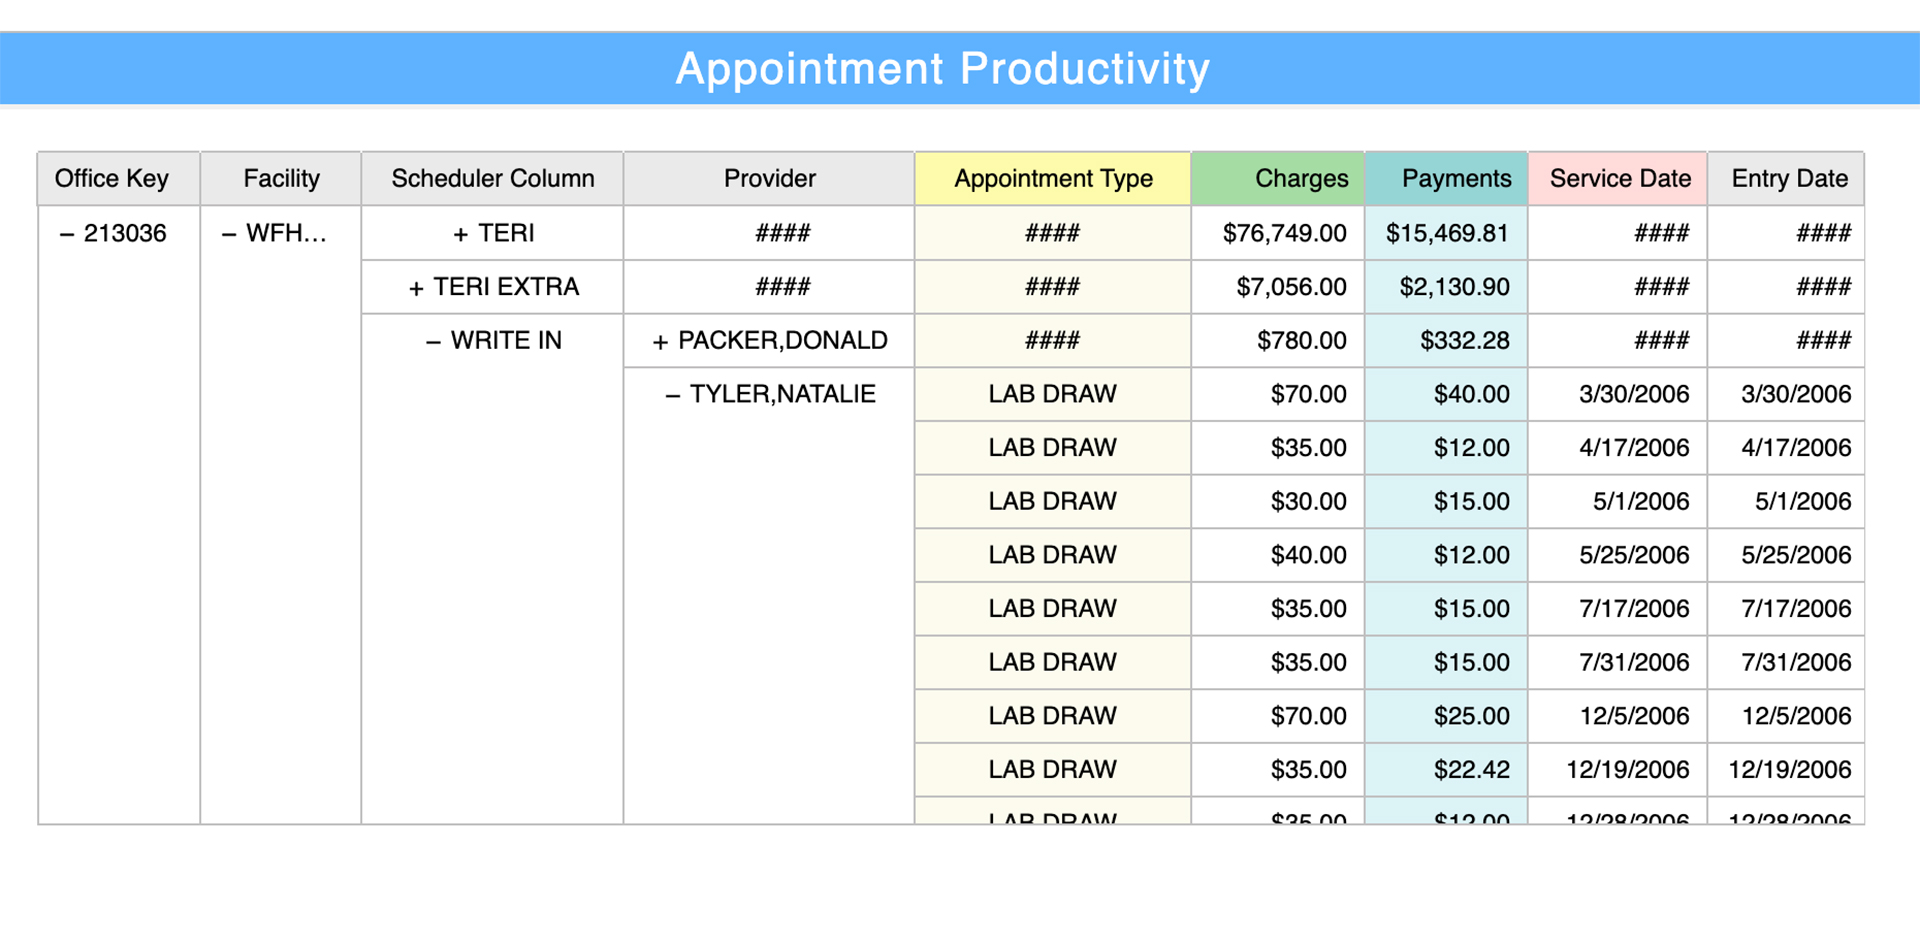
Page design now features various data containers or the types of reports you can create. We added a new report type called Data Table, a powerful flex report that anyone can run to get highly detailed elements of your data. For example, you can see a high-level profile of your office key, facility, and provider. By drilling down, you can analyze your data to identify gaps, problems, and pain points. Rows can be expanded and collapsed. Columns can be expanded and rolled up.

New Filter Finder
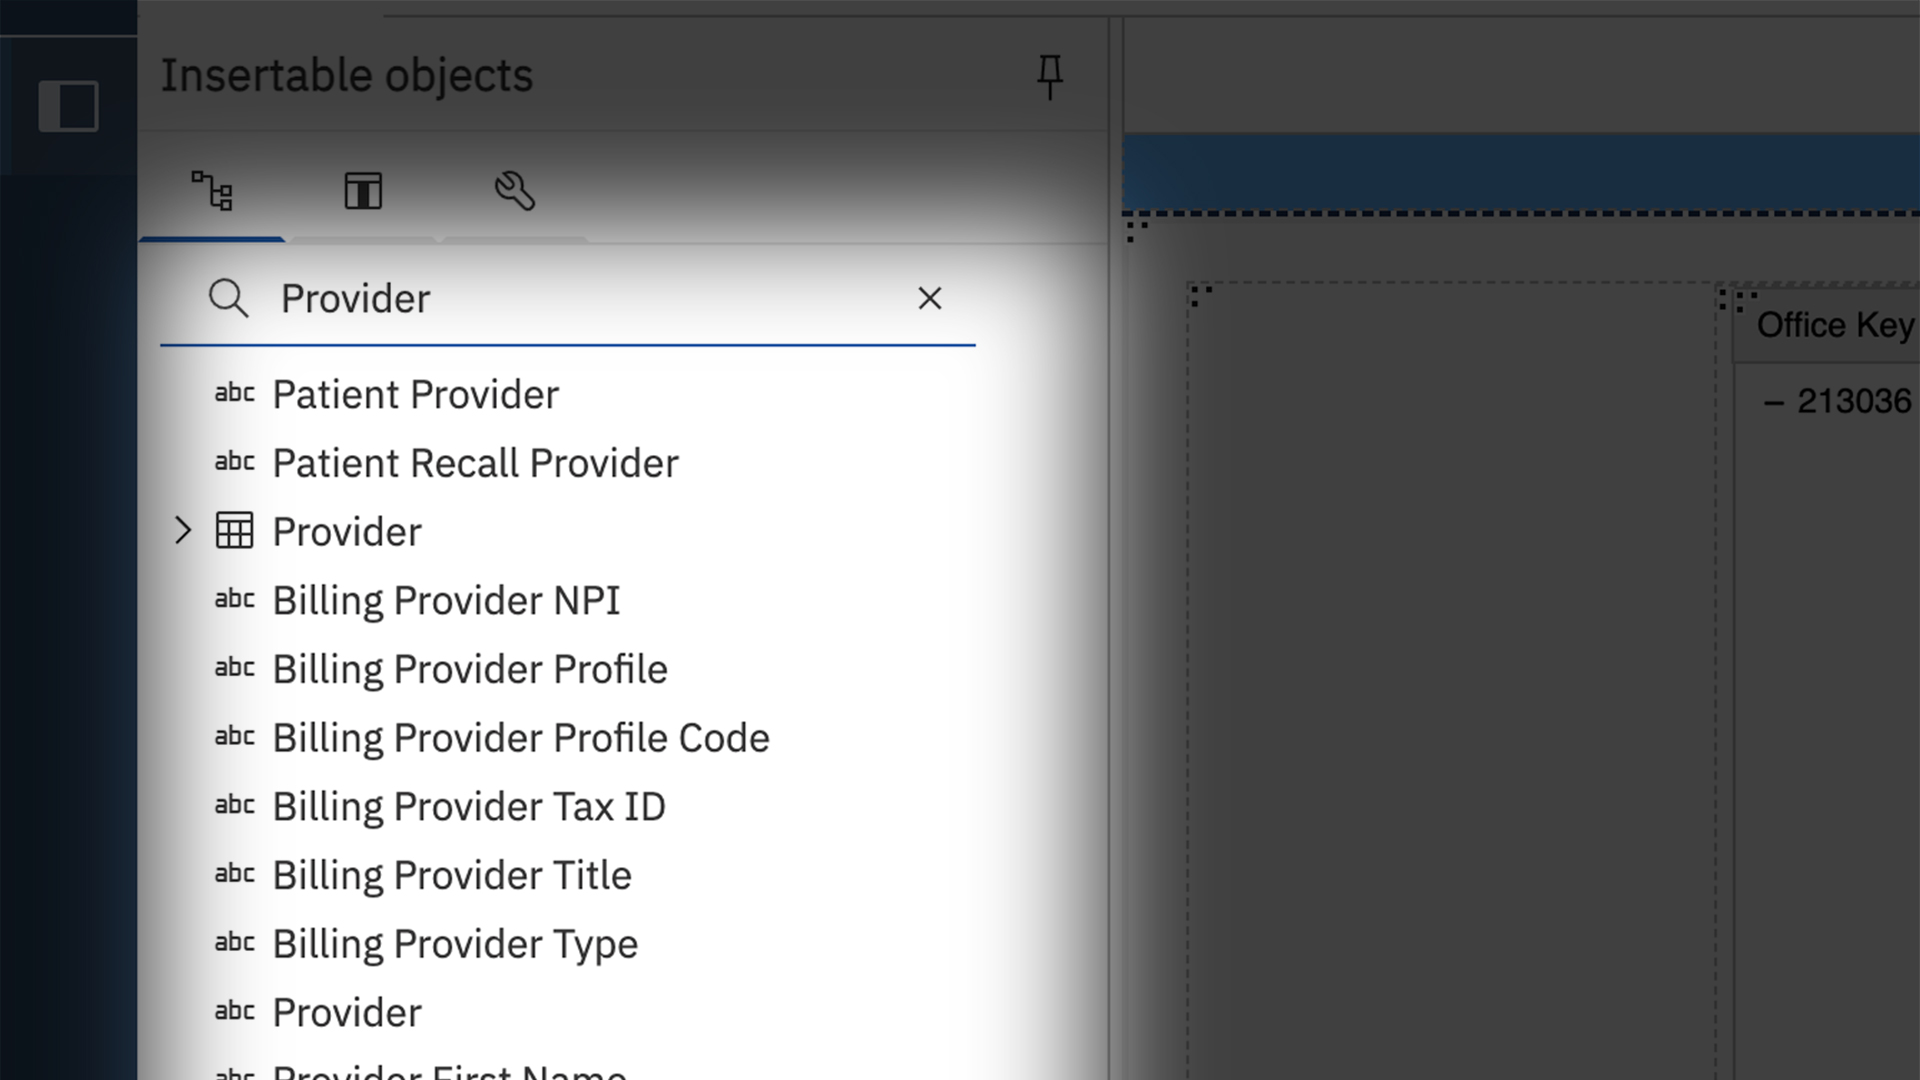
Our new filter finder lets you search for data points in the left-hand resource pane. Further refine your search results by selecting keywords like “Provider” or “Patient Age” to see filtered results that contain your search term or terms.

Smart Toolbar
Our Smart Toolbar can now be pinned or anchored to the top of your report. If you like our floating toolbar option, this too remains available.
Export Dashboards
You can now export your favorite dashboards into PDF so you can easily print, save, and share high-resolution content in a very small file size.
My Pin Feature
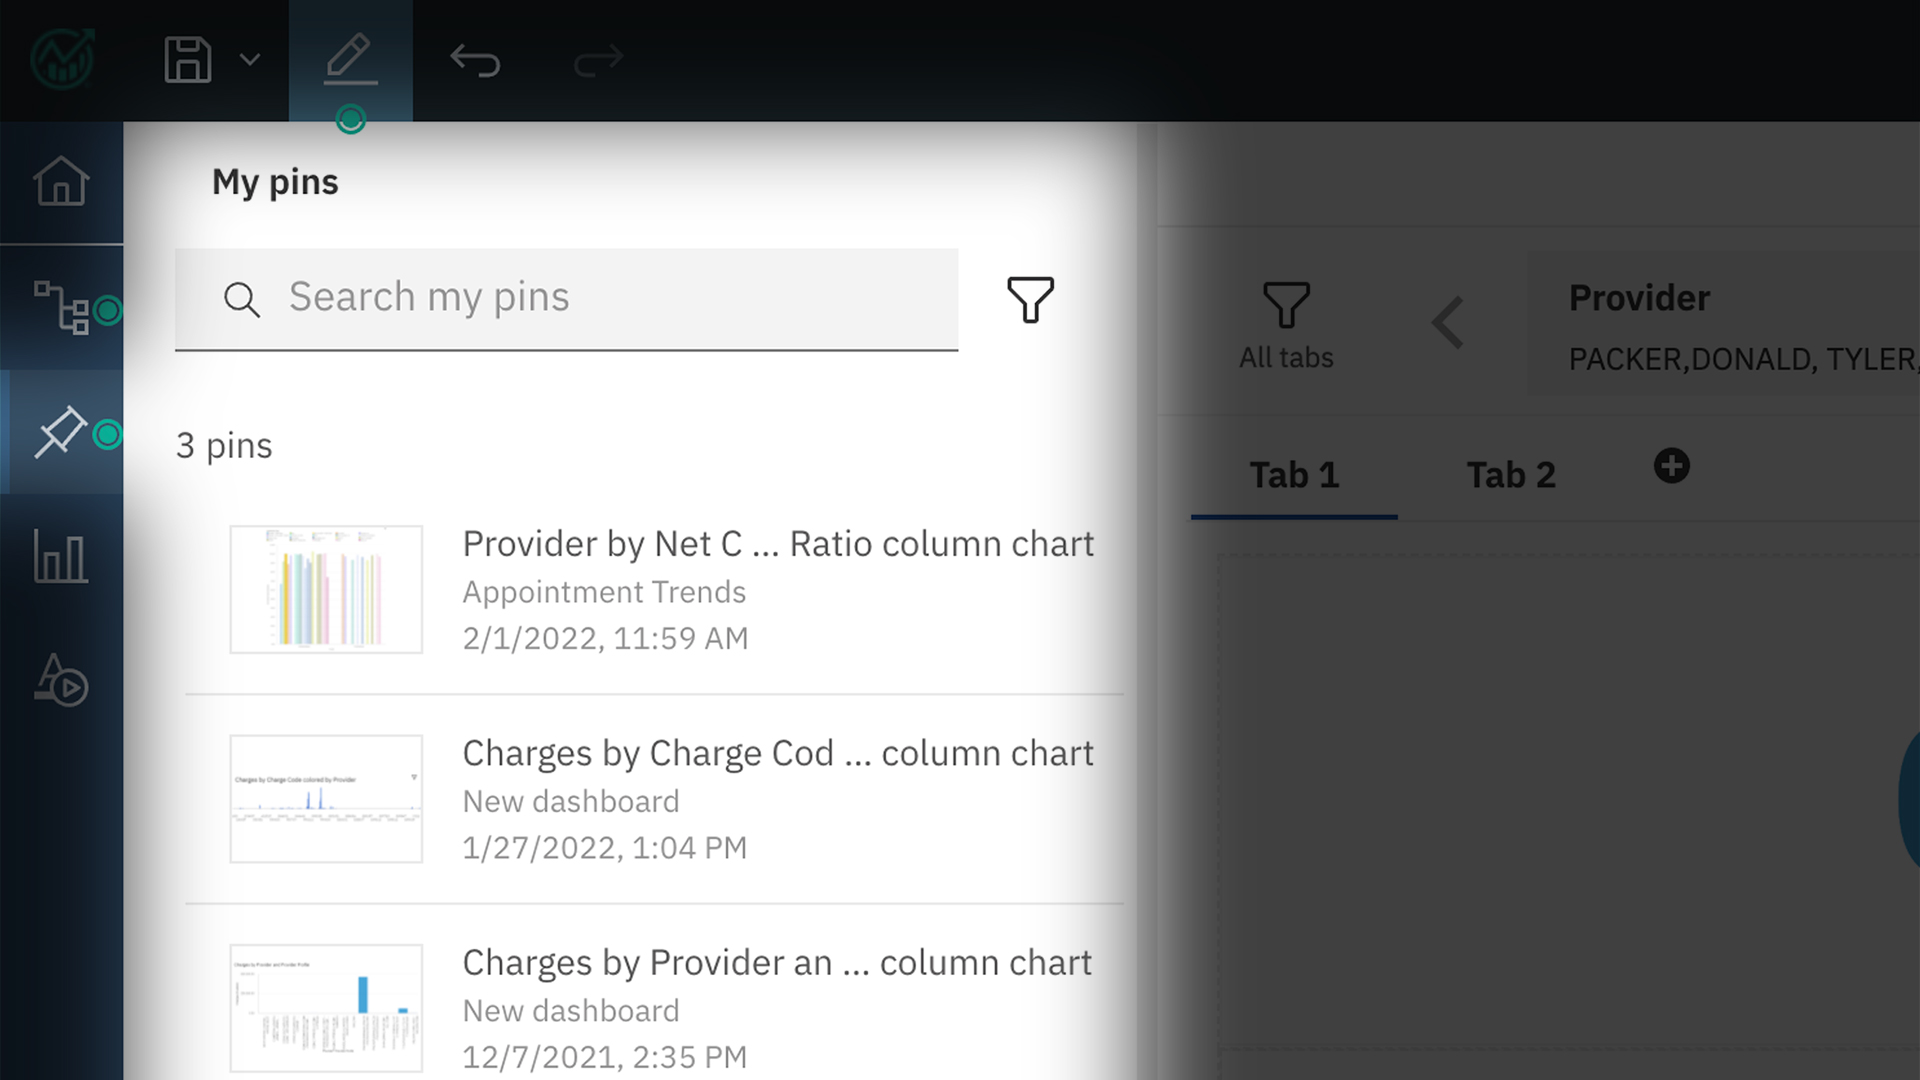
We added a pin feature. Pinning allows you to copy any standard or custom dashboard you create and use it in a new dashboard. This process retains all your filters, visualization and color elements, widgets, and other data points and other work from your original dashboard. You can immediately start a new dashboard that leverages the work you already created in your original pin. This is a huge time-saving feature to help you simplify new dashboards by leveraging existing, often complicated, dashboards.

Sharper Dashboard Colors
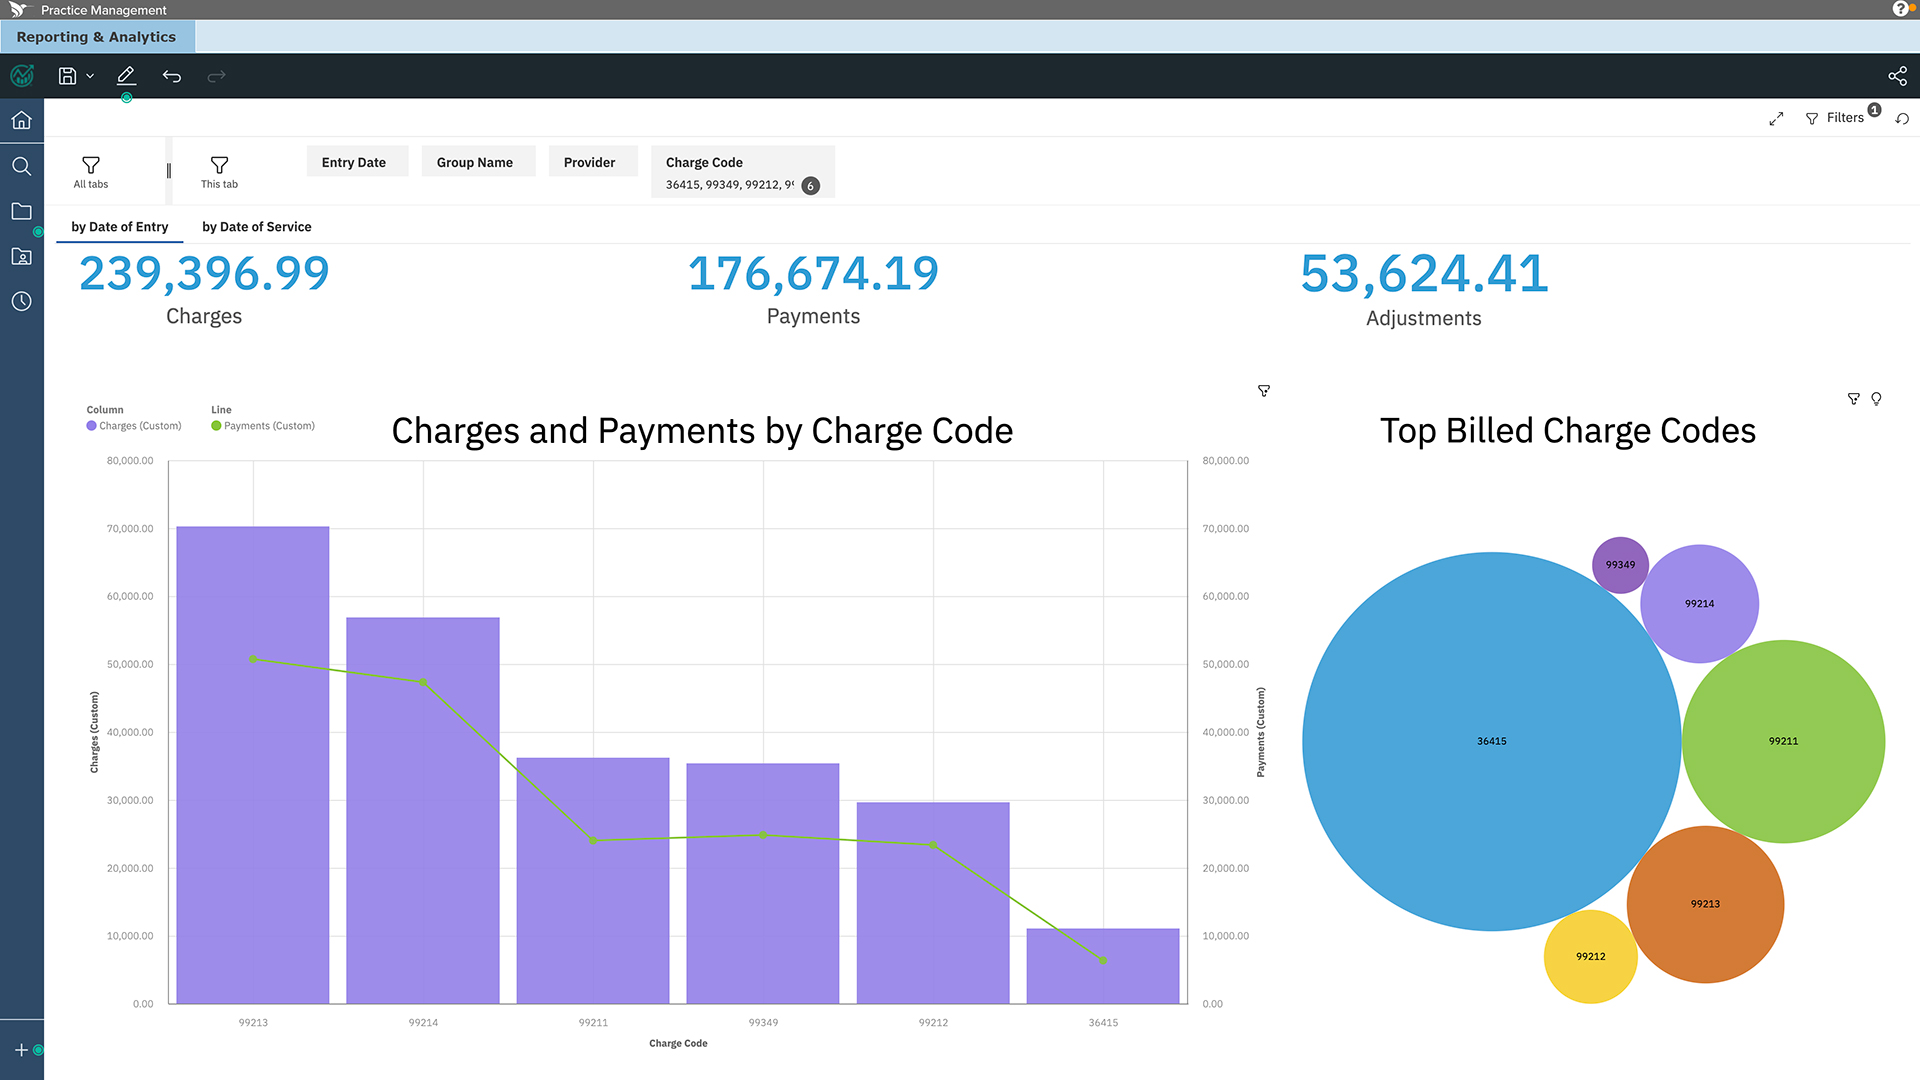
New and sharper dashboard colors let you build better, flashier, and more meaningful dashboards with crisper and cleaner views. You can produce more eye-popping charts and graphs to professionally showcase your reports and analytics.

Search Bar
We’ve added a search bar so you can more quickly and intuitively find reports and dashboards. You can search by category, keywords, and saved report or dashboard name. Results appear in a list view.

